At their recent summit in Ufa, Russia, the BRICS countries (Brazil, Russia, India, China and South Africa) highlighted knowledge and innovation sharing as a key area of focus for future cooperation. The summit also comes on the heels of a number of high profile national initiatives within the BRICS countries – such as Made in China 2025 and Make in India – which signal the desire of these countries to move into higher value-added segments within global value chains. In this post, I’ll take a look at how the BRICS countries are performing on some key research and development (R&D) indicators.
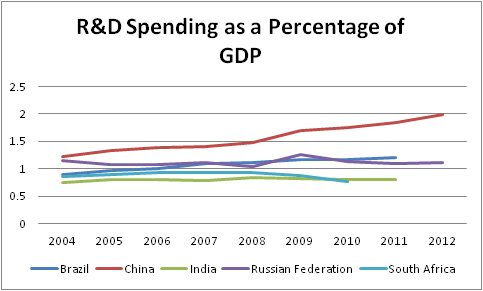
The chart above, which uses data from the World Bank, shows R&D spending for the BRICs countries as a percentage of GDP between 2004 and 2012. The clearest increase in percentage spending over this period comes from China, with Brazil showing a modest increase and the other countries remaining flat or declining. Over the same period, spending among OECD member countries averaged around 2.5% of GDP.
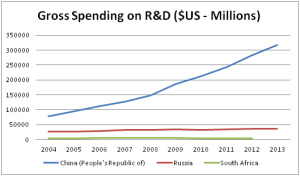
In light of significant economic growth, however, even relative stasis in terms of percentage spending is likely to mask significant increases in real money spent on R&D. The chart below uses data from the OECD to map spending in US$ millions over roughly the same period for China, Russia, and South Africa. In relation to the chart above, it demonstrates the impact of the growth in percentage spending combined with significant GDP growth in China since 2004 on that country’s overall R&D profile. In contrast, Russia and South Africa have remained relatively flat.
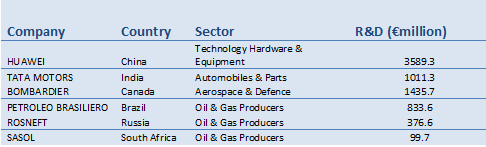
On the private side, the BRICS differ substantially on the number of domestic firms ranking in the top 2500 globally for research and development spending as recorded by the EU Industrial R&D Investment Scoreboard. Chinese firms dominate the rankings among the BRICS, with 199 companies among the top 2500 corporate spenders, led by Huawei (26) and PetroChina (64). They are followed in the rankings by India (24), Brazil (9),Russia (5) and South Africa (3). In comparison, Canada is home to 25 of the world`s top R&D spenders.
Top R&D Spenders in the BRICS and Canada – 2013
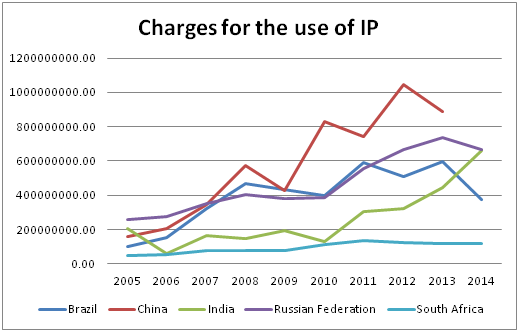
Finally, an additional data set from the World Bank provides insights into the success of the BRICS in commercializing their intellectual property resources internationally. The graph below charts charges for the use of IP between residents and non-residents between 2005 and 2013-2014. Once again, we see that China experienced the most robust growth among the BRICS countries over this period. India`s growth curve over the later years of the sample is also notable, particularly in light of concerns about that country`s ability to effectively monetize its IP assets.
Taken together, these indicators highlight China as an outlier among the BRICS countries with respect to innovation and R&D. Coupled with new government initiatives aimed at moving Chinese production up the value chain and developing capacity in areas such as semi-conductor manufacturing, it suggests – somewhat unsurprisingly – that China is best positioned among the group to capture gains accruing from high-value added industries. For the BRICs as a whole, the question remains to what degree the group can build on their Cooperation Agreement on Innovation and the recommendations of the BRICS Think Tank Council in order to to jointly foster innovation among the member countries. Finally, for Canadian policymakers and business leaders, growth in R&D and innovation among the BRICS points to the clear need to renew investments our domestic innovation systems in order to remain competitive.